STAAR & AP Test Scores
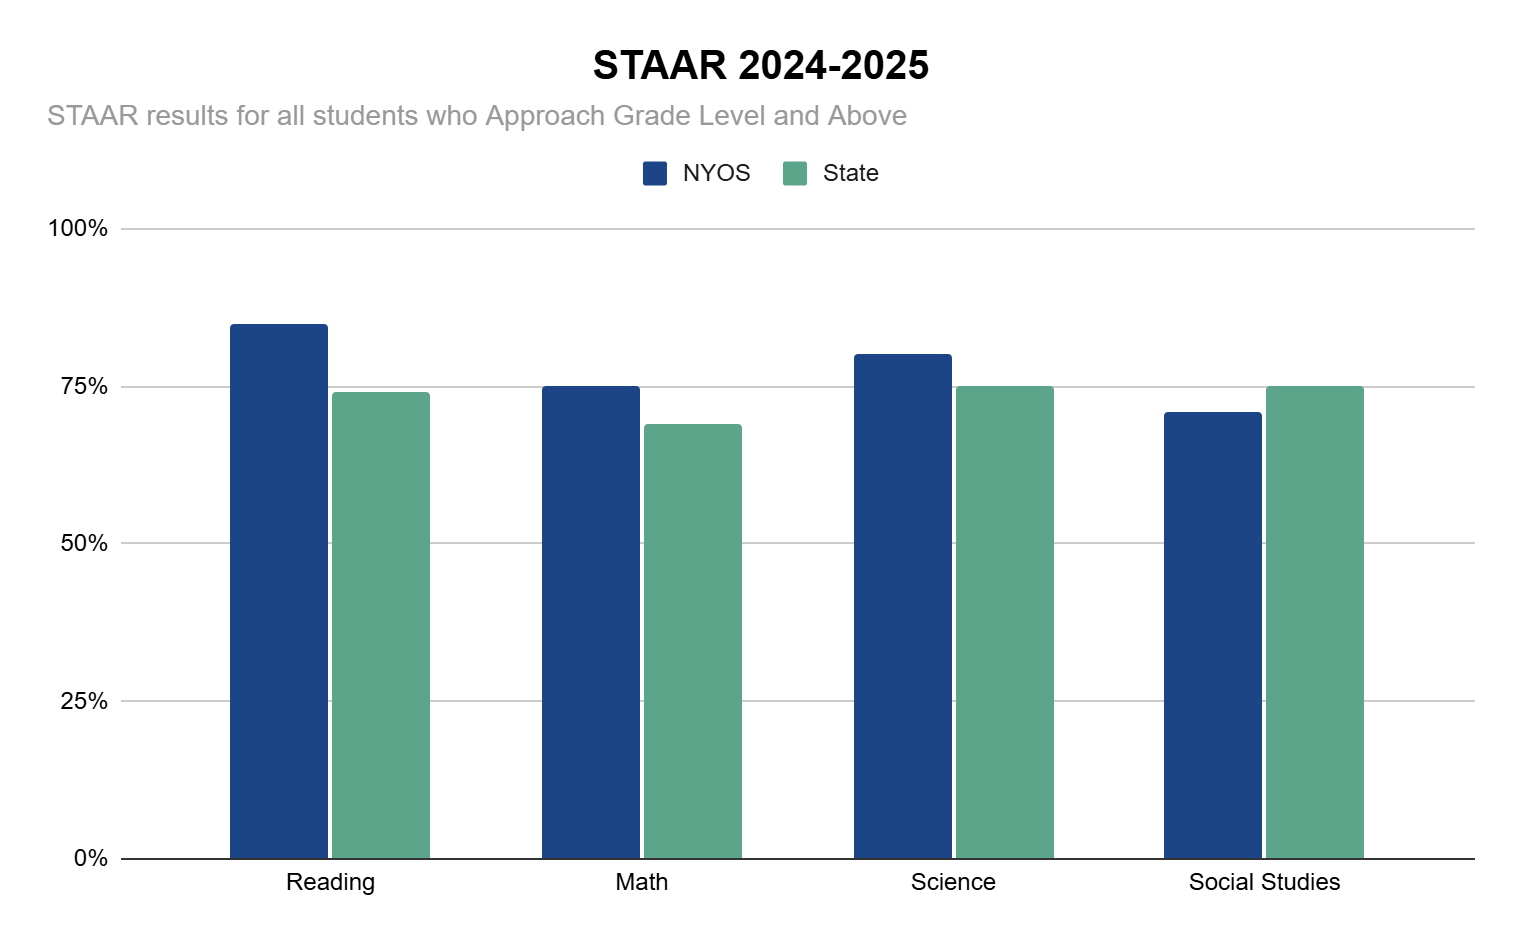
Below are graphs illustrating the STAAR Performance Data Table provided by the Texas Education Agency.
Approaching Grade Level and Above
These results show all students who are approaching, meeting, or above grade level.
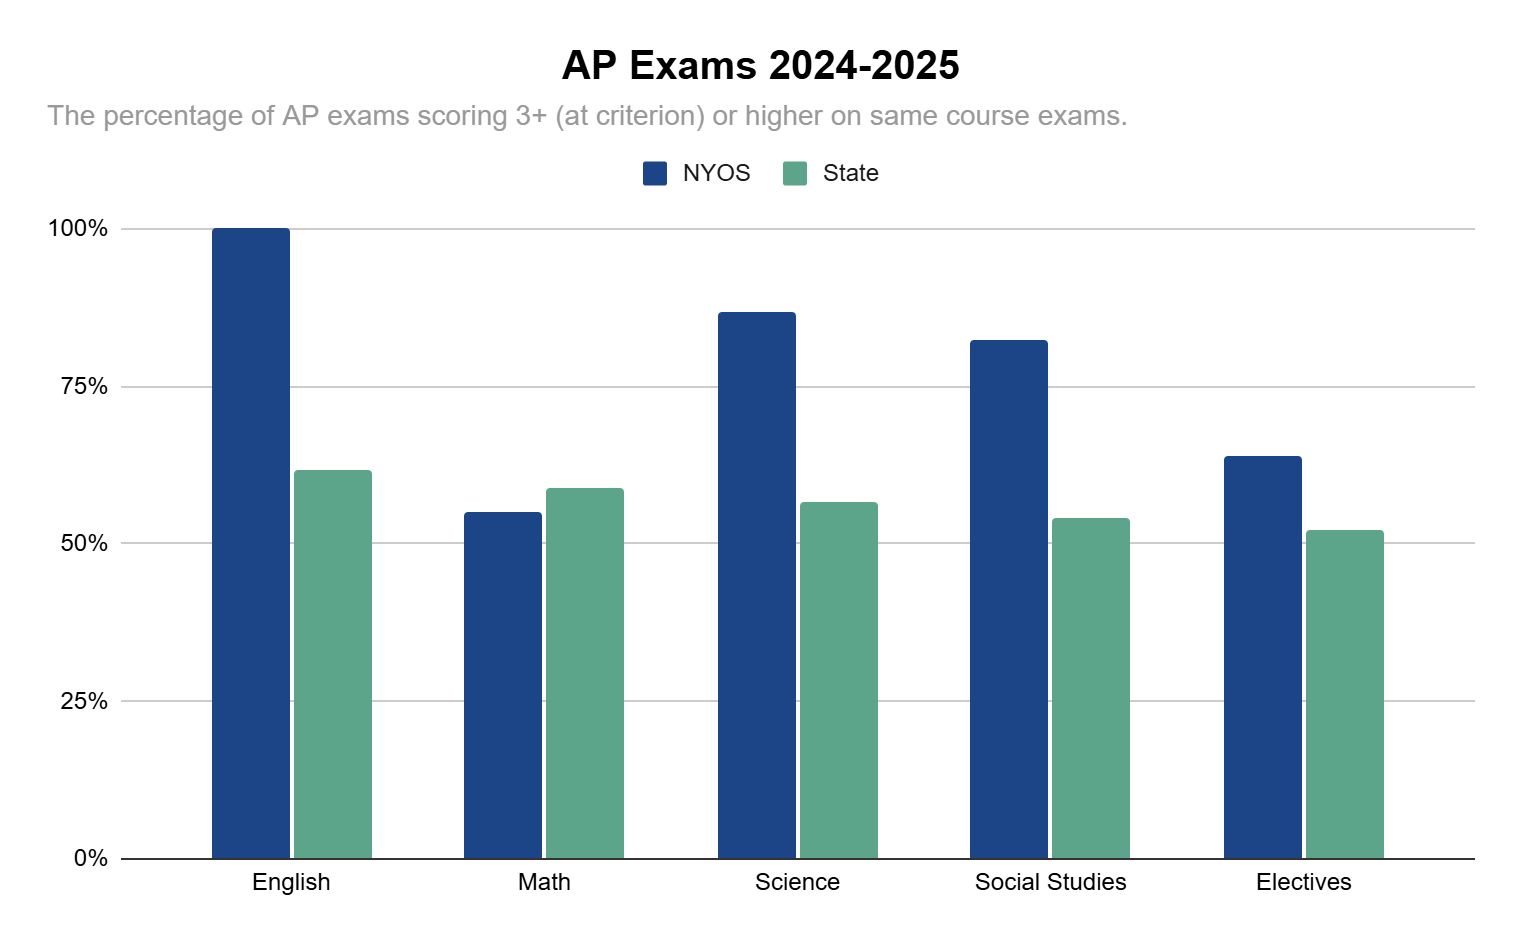
AP Exam Scores 3+ or higher
The percentage of AP students with exam scores of 3+ (at criterion) or higher.